“The environment is almost full” can mean several different things. A team may be looking at allocated virtual CPU, current CPU consumption, reserved memory, provisioned storage, or the physical space actually used. Those numbers answer different questions.
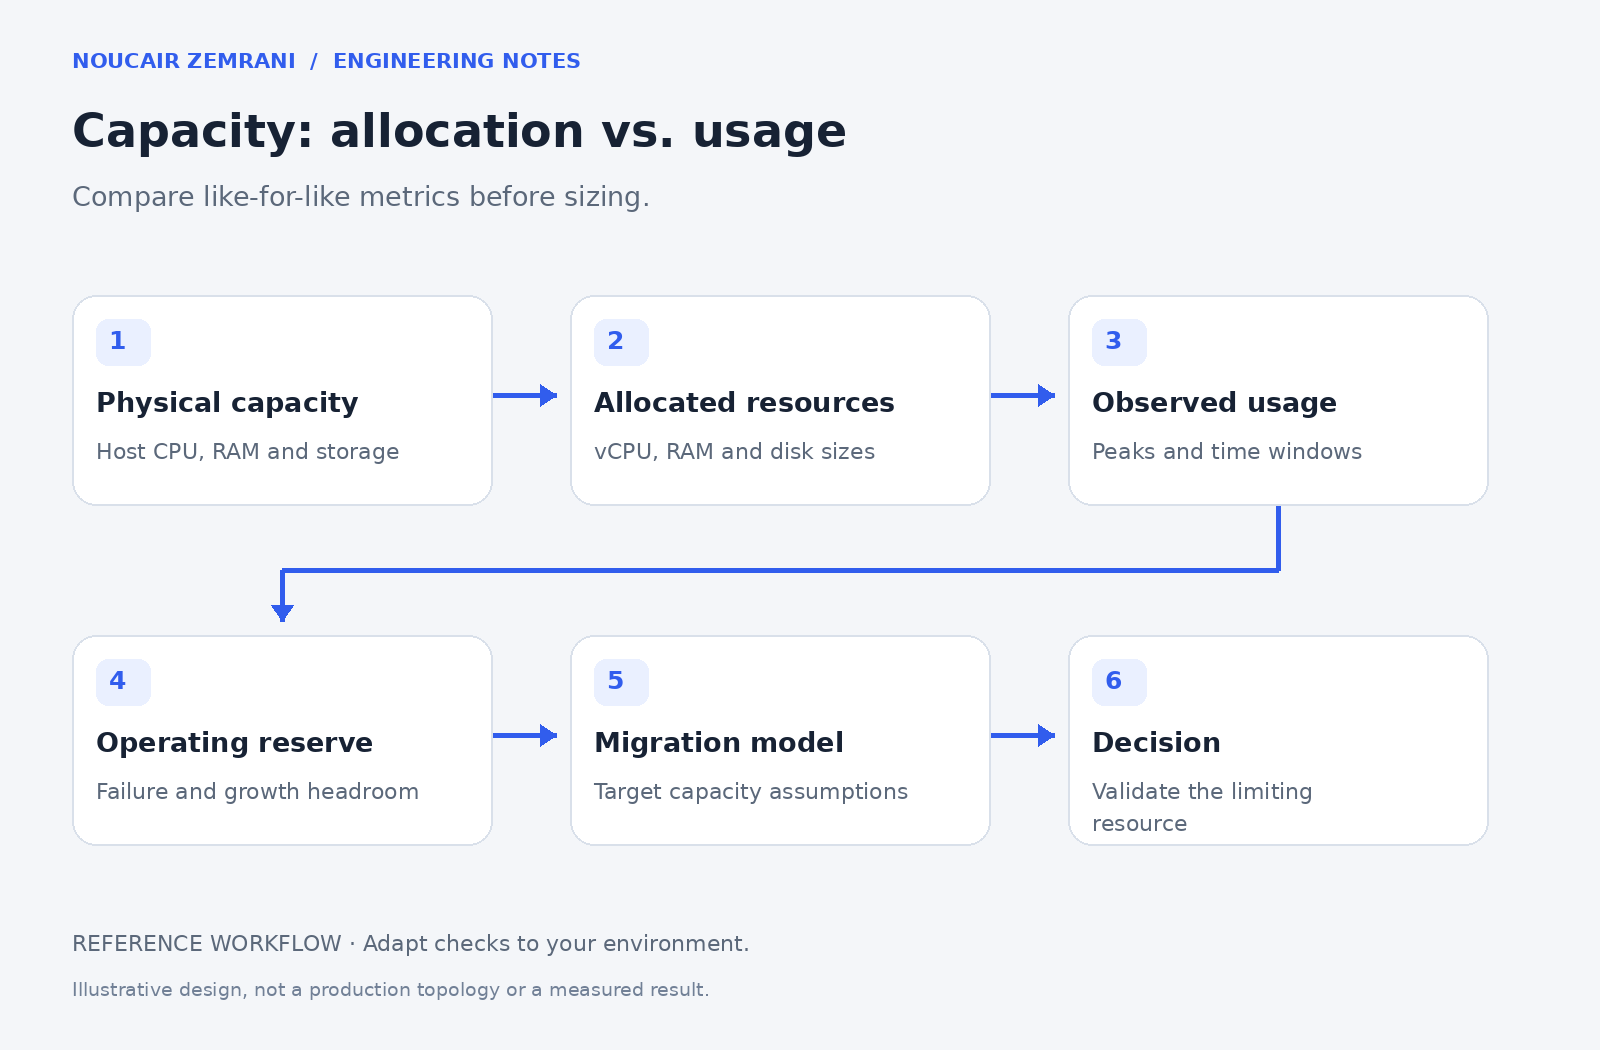
My work includes VMware and OpenShift utilization inventories and migration-capacity simulations. A useful report begins by naming the metric and its time window, then making the assumptions visible.
Keep capacity, allocation, and consumption separate
Capacity describes what the platform can provide within its operating constraints. Allocation describes what workloads are configured or entitled to use. Consumption describes what they are using over a measured period. A migration decision usually needs all three views.
Kubernetes adds another distinction: resource requests influence scheduling, while observed usage describes current behavior. A quiet node can still have limited scheduling headroom because of existing requests. Conversely, a momentary low reading does not prove that a workload can safely be downsized.
A synthetic example
Assume a target has 256 GiB of usable memory after platform overhead. Existing workloads consume 100 GiB at the selected planning peak, and the incoming workloads are estimated at 80 GiB using a comparable measurement method. The simple projected consumption is (100 + 80) / 256, or about 70.3%.
That arithmetic is not a migration approval. It excludes failover, growth, placement constraints, and uncertainty. If the usable capacity falls to 192 GiB during a host failure, the same 180 GiB demand becomes 93.75%. This example is fictional and is not a measurement of my employer’s systems.
Storage needs its own model
Distinguish logical provisioned capacity, physical consumption, free physical space, and expected growth. Thin provisioning does not create unlimited physical capacity. Snapshots, replication, retention, and storage-system overhead can change the practical headroom. Document which layer each number comes from.
Make the decision reviewable
For each platform and host, show capacity, used, free, percentage, metric source, and observation period. Add a migration scenario with explicit assumptions for incoming demand, platform overhead, failure reserve, and growth. Avoid mixing averages from one environment with peaks from another.
If data is missing, label the result as an estimate and identify what must be measured next. An honest uncertainty is more useful than a precise-looking percentage built from incompatible inputs.
If your team needs a capacity picture before a purchase or migration, I can help build an inventory and scenario model that a technical manager can actually review.